
The machine with the lowest purchase price may cost more to run. Total Cost of Ownership, or TCO, adds up what you spend to buy, install, operate, maintain, and retire the equipment, then subtracts its remaining value. Compare machines doing the same job over the same period. Choose from costs and performance you can support with evidence.
For cosmetic manufacturing, look beyond tank size or bottles per hour. Include cleaning time, product left in the equipment, utilities, spare parts, and the effect of a stoppage. This guide explains the cost categories, shows a worked example, and gives you questions to use when reviewing quotations.
1. Why the Cheapest Machine Can Cost More
1.1 Why Purchase Price Is Only the Beginning
A quotation tells you what the supplier will provide at an agreed price. Your factory will also pay to receive, install, run, and service that equipment. Our lowest-price machinery buying guide explains how a low starting price can leave important work outside the quoted scope.
1.2 What Is Total Cost of Ownership?
TCO is the cost of owning and using equipment over a chosen period. Life-cycle cost analysis uses a closely related approach, often bringing future costs back to today’s value. Return on Investment, or ROI, asks a different question: what financial benefit does the investment produce compared with its cost?
Start by defining the job. A 100L PLC vacuum emulsifying mixer should be compared with equipment that can make the same acceptable batches. Match the usable batch range, process, cleaning requirements, and output before comparing money.
1.3 The Machinery Iceberg
The iceberg is a useful picture: purchase price is easy to see, while years of smaller expenses are less visible. How much sits below the surface depends on the machine and its use. A lightly used laboratory mixer has a different cost pattern from a filling line running several shifts.
| Easy to see | Easy to overlook |
|---|---|
| Equipment price | Installation work and utility upgrades |
| Quoted production speed | Good output after stops, cleaning, and changeovers |
| Motor rating | Measured electricity use through a complete batch |
| Warranty period | What the warranty covers and how support is delivered |
| Spare-part price | Delivery time, replacement work, and production interruption |
1.4 Why TCO Matters for Cosmetic Manufacturing
Repeated batches make small differences worth checking. Product retained in a pipe, extra cleaning time, or unnecessary overfilling can add up. Use the cosmetic factory planning guide to connect the equipment comparison with your batch schedule and factory layout.
1.5 Who Should Use This Guide
Factory owners can use TCO to compare investment options. Production teams can supply cycle times and staffing needs. Maintenance teams can estimate service work and spare parts. Finance can check cash-flow assumptions. Agree these inputs together so each quotation receives the same test.
2. Understanding Every Component of Equipment TCO
2.1 Initial Investment
Include the equipment, selected options, freight, insurance, customs clearance, applicable duties, and delivery to the installation position. Use one currency and a stated exchange rate. Confirm the delivery terms so each transport or insurance charge appears once. The hidden equipment costs guide provides a wider purchasing checklist.
For taxes, separate amounts that remain a business cost from amounts your business can recover. Keep the treatment consistent across quotations and have your finance team confirm it.
2.2 Installation and Commissioning
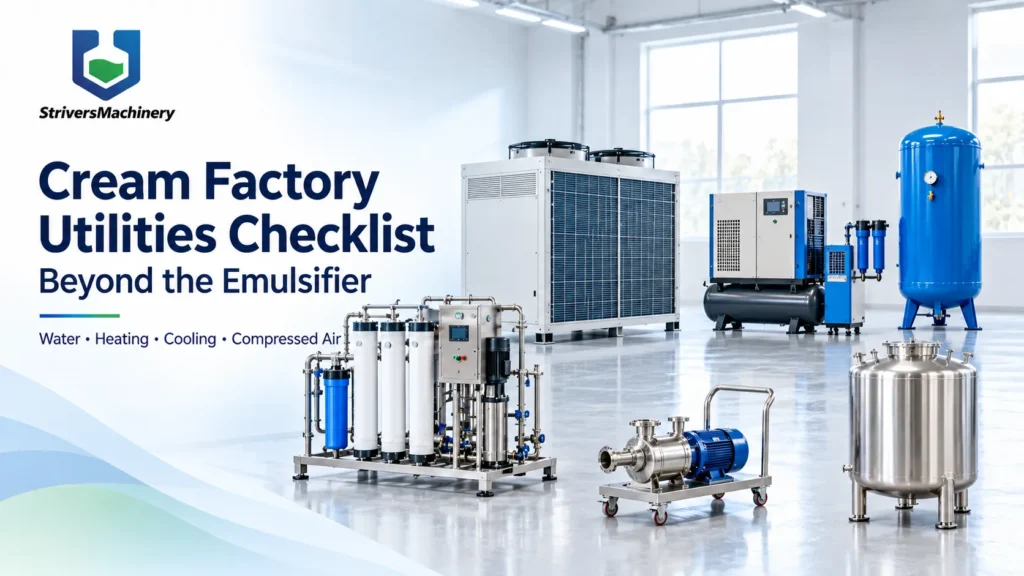
Installation may involve floor work, lifting, access platforms, electrical connections, piping, ventilation, and utilities. Confirm the site work before delivery using the cream factory utilities checklist. Record who supplies each item and who pays for travel, accommodation, and local contractors.
A 200L mobile heated mixing tank still needs suitable access, power, cleaning arrangements, and operating space. Mobility changes how you position the machine; the installation plan still needs those details.
IQ, OQ, and PQ mean Installation, Operational, and Performance Qualification. The documentation needed depends on the product, destination requirements, and customer quality system. Agree the tests, records, training, and responsibilities in the contract. Cosmetic and pharmaceutical projects can have different requirements.
2.3 Operating Costs
| Category | Build the estimate from |
|---|---|
| Electricity | Measured kWh per representative batch or production run, multiplied by planned runs and the tariff |
| Heating and cooling | Steam, fuel, cooling electricity, water, treatment, and service costs within a defined boundary |
| Labor | Staffing by task, paid time, local employment costs, cleaning, and changeovers |
| Water and cleaning | Ingredient water, rinse water, cleaning agents, sanitization, and waste handling |
| Product loss | Unrecoverable residue, overfill, rejected output, and startup losses at an appropriate cost |
A motor’s rated kW is not its electricity consumption throughout a batch. Measure the run where possible. Separate heating, mixing, homogenizing, cooling, and standby stages. Use the steam versus electric heating guide to compare heating services with the same process duty.
Count people across the whole line. A filler may need little direct attention while bottle loading, cap supply, packing, and cleaning still need staff. Estimate the actual change in paid hours or useful capacity when comparing automation.
Product transfer belongs in this estimate too. A mobile rotary lobe pump adds purchase and service costs, while its transfer arrangement affects time, product retained in pipes, and cleaning. Review those requirements using the process pump selection guide.
2.4 Maintenance and Spare Parts
List routine tasks, expected wear parts, service labor, inspections, and major repairs. Use the supplied component instructions and operating conditions. The vacuum emulsifying mixer maintenance guide helps organize the record. For each critical spare, record the exact part, price, stock location, and likely delivery time.
Preventive work is valuable when it reduces a real failure risk. Choose the tasks and frequency for the component and its duty. Some parts need scheduled replacement, while others benefit from condition checks. Include service access and the time needed to return the machine to production.
2.5 Downtime: Estimate the Production Effect
A small failed component can interrupt a much larger production plan. Estimate how long diagnosis, spare-part delivery, repair, cleaning, and restart could take. Then check whether another machine, stored product, or a later shift can recover the output.
| Possible effect | How to estimate it |
|---|---|
| Production that cannot be recovered | Lost sales less the variable costs avoided; use the remaining contribution to covering fixed costs and profit |
| Recovery work | Extra overtime, subcontract production, or additional freight actually needed |
| Batch loss | Unrecoverable materials and work already spent on the affected batch |
| Repair and restart | Additional repair, testing, cleaning, and restart costs not counted elsewhere |
| Customer impact | Contractual penalties or other supported costs, recorded separately from uncertain effects |
Count each cost once. If repair spending is already in maintenance, leave it out of the downtime line. If a lost-sales estimate includes the value of a scrapped batch, check the overlap. Lost sales revenue alone usually overstates the financial loss because some production costs are avoided.
Our mechanical-seal cooling-water case shows why a supporting service deserves attention during a stoppage review. Use your own production and service records to put a cost on the interruption.
2.6 Quality and Compliance Costs
Recommended Equipment


100L Hydraulic Lift Vacuum Emulsifying Mixer with Button Control for Cosmetic Cream and Lotion Production
View Details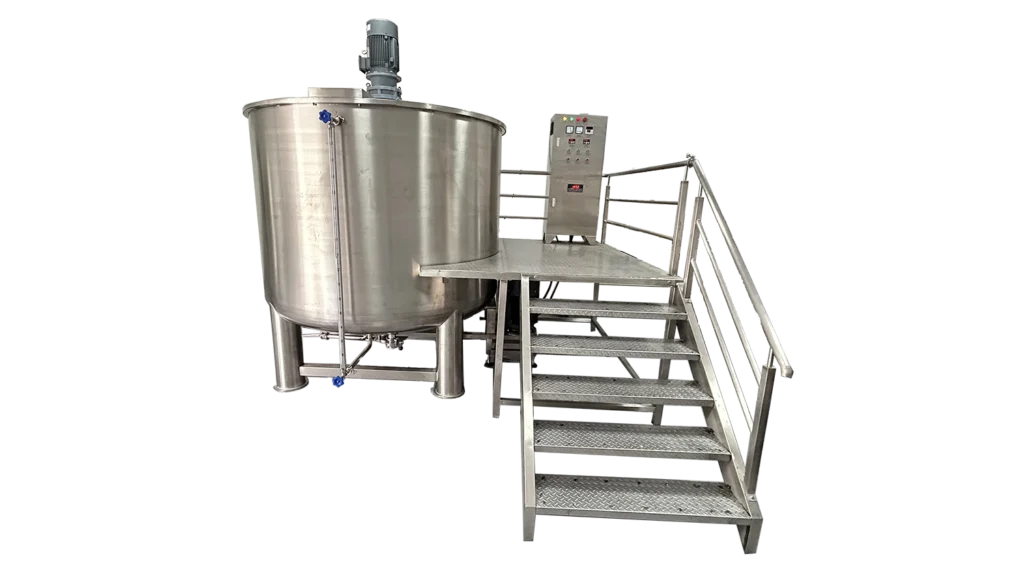
Include applicable testing, documentation, calibration, cleaning checks, and training. For failures, estimate the additional investigation, rework, disposal, or recall costs that fit the scenario. Keep uncertain risks in a separate scenario so the reader can see what changes the result.
Cleanability affects both cost and product quality. The equipment cleaning dead corners guide explains how retained product and poor access create extra work. Compare these details on the actual equipment, including welds, seals, outlets, and connected pipework.
2.7 End-of-Life and Residual Value
Include dismantling, removal, disposal, and any replacement needed within the study period. Subtract a supported resale or salvage value at the end. Maintenance history, condition, documentation, buyer demand, and removal costs all matter when estimating that value.
If one option needs replacement before the comparison ends, include the replacement cost and its remaining value. This keeps a short-life option and a long-life option on the same time basis.
3. How to Calculate TCO
3.1 The Complete TCO Formula
Undiscounted TCO = purchase and installation + operating costs + maintenance and repairs + additional downtime and quality costs + replacements and disposal − residual value
Assign each cost to one category and one year. The categories help you organize the numbers; they should not create duplicate charges. For a discounted comparison, bring each future cost or receipt back to its present value before adding it.
3.2 Five-Year vs Ten-Year Analysis
Choose a period that fits the production plan, expected use, and investment decision. Five years may suit a shorter project. Ten or fifteen years can be useful when continued operation is supported by the business plan. Use the same period for both options and include any replacements needed.
Start with the same annual good output and quality requirements. If capacities differ, include the cost of meeting the remaining demand. You can also report cost per accepted batch or per thousand saleable bottles, alongside total cost.
3.3 ROI, Payback Period, NPV, and IRR
| Measure | Question it answers | What to watch |
|---|---|---|
| TCO | What will this option cost over the study period? | Same output, scope, currency, and period |
| ROI | What net benefit is generated relative to the defined investment? | State the calculation, period, and what counts as a benefit |
| Simple payback | How long until annual net savings recover extra initial spending? | Requires positive savings; ignores discounting and later cash flows |
| NPV | What is the value today of the project’s net cash flows? | Use a consistent discount rate and clearly defined cash flows |
| IRR | At what discount rate would NPV equal zero? | Check NPV as well; different project sizes and unusual cash flows can make IRR misleading |
Simple payback = extra initial installed cost ÷ annual net savings
For an upgrade, compare the extra cost with the extra benefit relative to the alternative. Separate production capacity you could sell from capacity that would sit unused. Finance should set a discount rate that fits the business decision.
3.4 A Worked TCO Comparison
The following example uses invented figures only to show the calculation. It is not a quotation, customer result, or savings promise. Assume both options deliver the same annual acceptable output for five years. All amounts are USD in constant purchasing-power terms. Costs occur at year end except the initial investment.
| Assumed input | Option A | Option B |
|---|---|---|
| Purchase and installation, year 0 | $80,000 | $100,000 |
| Annual operation, including labor, utilities, cleaning, and normal product loss | $60,000 | $54,000 |
| Annual maintenance and repair | $6,000 | $5,000 |
| Annual additional downtime and quality allowance, excluding costs above | $4,000 | $3,000 |
| Disposal cost, end of year 5 | $2,000 | $2,000 |
| Residual value, end of year 5 | $5,000 | $8,000 |
| Five-year undiscounted TCO | $427,000 | $404,000 |
| Present value of costs at an assumed 8% real discount rate | $357,448 | $343,465 |
Option B costs $20,000 more initially and saves an assumed $8,000 a year in recurring costs. Simple payback is 2.5 years, excluding disposal and resale from that shortcut. Its five-year undiscounted TCO is $23,000 lower. At the illustrative 8% real discount rate, the present-value cost difference is about $13,983.
The assumed savings decide the outcome. If recurring savings were only $2,000 a year, simple payback would be ten years, beyond this five-year study. Replace the example inputs with supported figures before choosing equipment.
3.5 Build Your Own Calculator and Check Common Mistakes
Use one spreadsheet column for each year and one row for each cost. Add the source beside every input: quotation, meter reading, payroll estimate, maintenance record, or assumption. This makes the comparison easy to update when a supplier confirms a missing item.
| Check | Practical action |
|---|---|
| Scope | Compare the same included equipment, installation work, and documentation |
| Prices and inflation | Use either constant-price costs with a real discount rate or inflation-adjusted costs with a nominal rate |
| Labor increases | Separate general inflation from specific changes in staffing or pay |
| Availability | Allow for planned service, changeovers, and a stated unplanned-stop scenario |
| Uncertainty | Test low, expected, and high production levels and the most uncertain cost inputs |
| Residual value | Use a supported estimate and test a lower-value case |
| Double counting | Check labor, rejected product, repair, downtime, and quality lines for overlap |
A simple model with traceable inputs is more useful than a detailed spreadsheet filled with guesses. NIST’s life-cycle costing manual, listed below, explains discounting and consistent use of constant and current prices. Use its methods with project-specific inputs instead of adopting federal project rates automatically.
4. Equipment Comparisons: Where Lifetime Costs Change
4.1 Vacuum Emulsifying Mixer Comparison
Compare purchase price alongside complete batch time, accepted output, cleaning, and product recovery. A 1000L fixed vacuum emulsifying mixer and an external-circulation emulsifying mixer have different process and service details to assess. Match those details to the formulation before assigning savings.
The vacuum emulsifying mixer buying guide helps define the process test. Request representative batch records, energy measurements, transfer recovery, and cleaning times. For existing project comparisons, keep the recorded outcome and show the operating conditions behind it.
4.2 Filling Machine Comparison
Manual, semi-automatic, and automatic filling suit different volumes and staffing plans. Compare the full operation: feeding containers, filling, capping, checking, cleaning, and packing. Use measured overfill and rejection rates to estimate product loss.
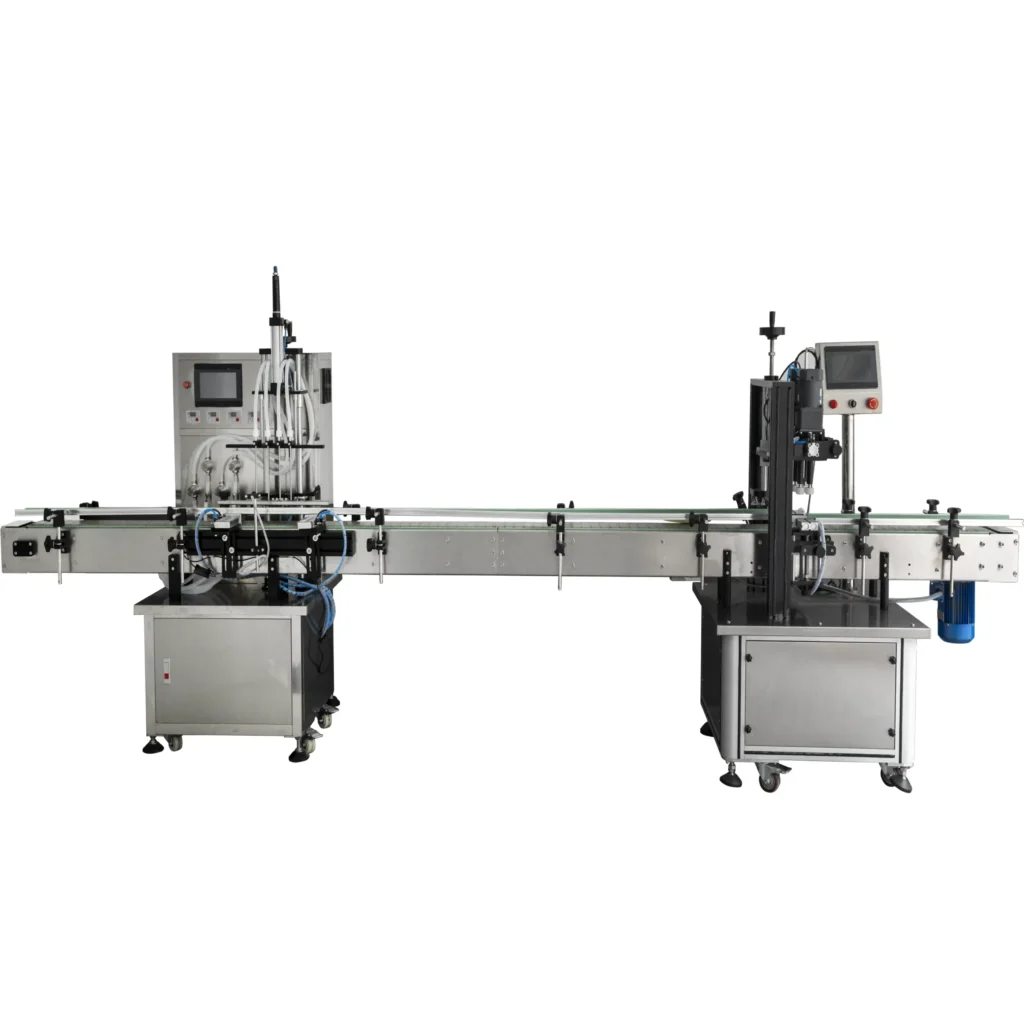
A single-head servo gear-pump filler may suit one production pattern, while a six-head gear-pump filling machine serves another. Compare both at your required product, container, fill volume, and production schedule.
Use the filling accuracy testing guide to define a fair measurement method. Our time-based versus volume-based filling guide explains why dosing method and product conditions affect the result. Automation pays back when supported savings and useful extra output cover its added costs.
4.3 Water Treatment System Comparison
Choose the required water quality first, then compare systems that meet it. Single-pass RO, double-pass RO, and RO with EDI differ in treatment duty and operating requirements. EDI removes ions; microbial control also needs attention. Storage, distribution, sanitization, source water, and monitoring affect the final result.
For a 1000L/h double-pass RO system, calculate useful daily water production, water recovery, reject-water handling, consumables, electricity, and sanitization. The cosmetic water treatment guide explains how the treatment stages fit together.
4.4 Complete Production Line Comparison
Related Solutions


A single supplier can simplify coordination when the contract gives that supplier clear responsibility for line performance. A multi-supplier project can also work well with an effective integrator. Compare responsibility for interfaces, controls, commissioning, acceptance, and support under either arrangement.
Include the equipment between the main machines: pumps, conveyors, buffer storage, utilities, and handling. Review the heating, mixing, and filling guide to check the handover conditions between process stages. Good integration needs an agreed scope and test plan.
5. What Really Determines Machinery TCO?
5.1 Equipment Design
Look for cleanable surfaces, practical access, drainage, suitable seals, and product paths that can be emptied. Measure cleaning and changeover work where possible. Our CIP versus manual cleaning guide helps define the work to include in the comparison.
Utilities can change the result too. The recirculating cooling-water project shows how the cooling arrangement fits into a mixing installation. Include the pump, heat removal, water treatment, and maintenance in the relevant cost boundary.
5.2 Material Quality
Choose product-contact materials for the formulation, cleaning chemicals, temperature, and exposure time. 316L offers an advantage over 304 in some corrosive conditions. Where 304 meets the duty, the extra material cost may bring little benefit. Our 304 versus 316L equipment guide explains the selection questions.
Check weld quality, surface condition, seals, and documentation alongside the alloy. The finished assembly and its use determine the maintenance burden.
5.3 Component Brands
Recognized brands can make sourcing easier, but availability depends on the exact model and location. Ask a local distributor about stock, alternatives, and lead times. Keep backups of PLC and HMI programs where applicable, together with access arrangements and restoration instructions.
5.4 Automation Level
Match automation to demand, product mix, and changeover frequency. A machine that saves filling labor may add setup, cleaning, programming, or specialist service work. Test the tasks across a normal production week. The mixing and packaging upgrade guide helps compare a focused retrofit with a full replacement.
5.5 Supplier Support
Ask for a clear installation scope, training plan, support contact, response process, and spare-parts list. Confirm what remote support covers and when an on-site visit may be needed. The manufacturer versus trading company guide explains why capability and responsibility matter alongside the supplier’s business type.
6. Practical Strategies to Reduce TCO
6.1 Buy for the Required Lifetime Output
Define acceptable output before reviewing options. Remove features that add no useful value, and protect the features that affect quality, cleaning, safety, and service. Use the cosmetic equipment buying guide to turn production needs into a clear specification.
6.2 Invest Where Energy Savings Are Supported
Compare input power at the loads and speeds you expect to use. Higher-efficiency motors can reduce losses when properly selected, while operating hours determine the value of that saving. Heating, cooling, vacuum, and compressed air may also offer opportunities. Meter the larger loads first.
For a 500L shampoo mixing machine, review the full batch cycle. Include cleaning and cooling alongside mixing. A shorter cycle helps when it maintains quality and produces capacity you can use.
6.3 Standardize Suitable Components
Use common components where the duty permits. Keep exact specifications and approved alternatives so maintenance can order the right item. A shared brand alone does not make different parts interchangeable. Concentrate stock on failures that would stop production and take time to repair.
6.4 Build a Practical Maintenance Plan
Start from the supplied manuals, then adjust using condition and service records. Assign responsibility, record findings, and plan access before the next inspection. Consider heat, moisture, dust, and local water quality using the tropical-climate maintenance guide.
6.5 Use Monitoring Where It Supports a Decision
Choose signals that lead to a useful action: temperature, pressure, motor load, leakage, vibration, or cycle time. Confirm the sensors, recording, alarms, and support included in the offer. PLC control alone provides no prediction of component failure. Buy monitoring for a defined problem and a workable response.
Decision Guide
7. Procurement Checklist: Questions Every Buyer Should Ask
7.1 Machine Quality
| Ask | Useful evidence |
|---|---|
| Can this machine make our products across the agreed batch range? | Representative test conditions, output criteria, and results |
| What materials and components are supplied? | Identified grades, models, drawings, and relevant records |
| How will we empty and clean it? | Access review, cleaning procedure, and retained-product checks |
| How will it fit our factory? | Final layout, dimensions, service space, utility list, and delivery route |
7.2 Operating Cost
| Ask | Useful evidence |
|---|---|
| What energy does a normal run use? | Metered consumption with product, batch size, timing, and measured equipment identified |
| How many people are needed? | Tasks across feeding, operation, cleaning, checking, and packing |
| How much product is lost? | Measured transfer residue, overfill, startup loss, and rejection |
| What output is saleable? | Good output after normal stops, changeovers, and quality checks |
7.3 Maintenance
| Ask | Useful evidence |
|---|---|
| Which parts need routine service? | Component-specific tasks, intervals, and access requirements |
| Which parts could stop production? | Critical spare list, exact identification, stock, and lead times |
| How long does replacement take? | Repair procedure, lifting or access needs, and restart checks |
7.4 Long-Term Support and Acceptance
Agree the documents, warranty coverage, training, service charges, and test responsibilities in writing. Use the filling-machine factory acceptance testing guide to plan checks before shipment. Keep site acceptance tied to the agreed product, utilities, operating conditions, and pass/fail criteria.
8. Final Thoughts: Buy Production Capacity, Not Just Equipment
8.1 Think Beyond the Quotation
The quotation is the starting point. Add the cost of making acceptable product, cleaning the equipment, maintaining it, and handling interruptions. A higher price can be justified by supported savings; a lower price can be the better choice when it meets the same needs at lower total cost.
8.2 Make TCO a Working Record
After installation, replace estimates with actual readings and service records. Compare expected and actual energy, staffing, cleaning, loss, and downtime. The differences show where to improve and help you make the next purchasing decision with better information.
8.3 Your Next Step Before Purchasing
Send suppliers the same production requirements. Ask for comparable scope and evidence, build a year-by-year cost table, and test uncertain inputs. Choose the option that meets the required quality and output with a cost, service plan, and cash commitment your business can accept.
Reference Tools for Your TCO Review
Use the cost categories in Section 2 as spreadsheet rows. Use Section 3’s example to check the arithmetic and Section 7’s questions to collect missing inputs. Keep the quotation, supporting records, and assumptions beside the calculation so others can review it.
Technical References
- NIST: Life Cycle Costing Manual for the Federal Energy Management Program — 2025 Edition
- U.S. Department of Energy: Determining Electric Motor Load and Efficiency
- FDA: Good Manufacturing Practice Guidelines and Inspection Checklist for Cosmetics
- Outokumpu: Corrosion Tables and Charts for Stainless Steel